Defining the Fetal Gene Program at Single Cell Resolution in Pediatric Dilated Cardiomyopathy.
Authors:
Neda R. Mehdiabadi, Choon Boon Sim, Belinda Phipson, Ravi K. R. Kalathur, Yuliangzi Sun, Celine J. Vivien, Menno ter Huurne, Adam T. Piers, James E. Hudson, Alicia Oshlack, Robert G. Weintraub, Igor E. Konstantinov, Nathan J. Palpant, David E. Elliott, Enzo R. Porrello
Abstract
Background:
A central dogma in cardiac biology is that the gene expression pattern observed in postnatal heart resemblance to those observed during fetal cardiac development in response to stress. The phenomenon of fetal gene re-activation in heart failure has been traditionally studied in cardiomyocytes, however, the extent to which the fetal gene program is recapitulated in other cardiac cell types is unknown. We present single nuclei RNA sequencing of apical left ventricle tissue from fetal (19-20 weeks, n=3; 27,760 nuclei), non-diseased (ND; 4-14 years, n=3; 16,964 nuclei) and early-onset DCM samples (5-10 years, n=4; 32,712 nuclei) to define the human fetal gene program in dilated cardiomyopathy (DCM), a common cause of heart failure in children and adults.
Methods and Results:
We performed single nuclei RNA sequencing with heart tissues from 3 fetal, 3 non-diseased and 4 DCM (for sample characteristics see the Table, and for method see Fig.1A). Single nuclei RNA seq analysis revealed 7 cell clusters across fetal, ND and DCM samples. Also, we investigated that the fetal gene program is broadly re-engaged in cardiomyocytes and cardiac fibroblasts and is not restricted to specific cell sub-populations in DCM. Also, this study provided insights into the central dogma in cardiac biology that the postnatal heart adopts a fetal-like transcriptional state in response to stress. Here, we noted a proportion of genes (<10%) adopting a fetal-like expression pattern in both cardiomyocytes and cardiac fibroblasts, suggesting that multiple cardiac cell types redeploy developmental transcriptional networks in DCM.
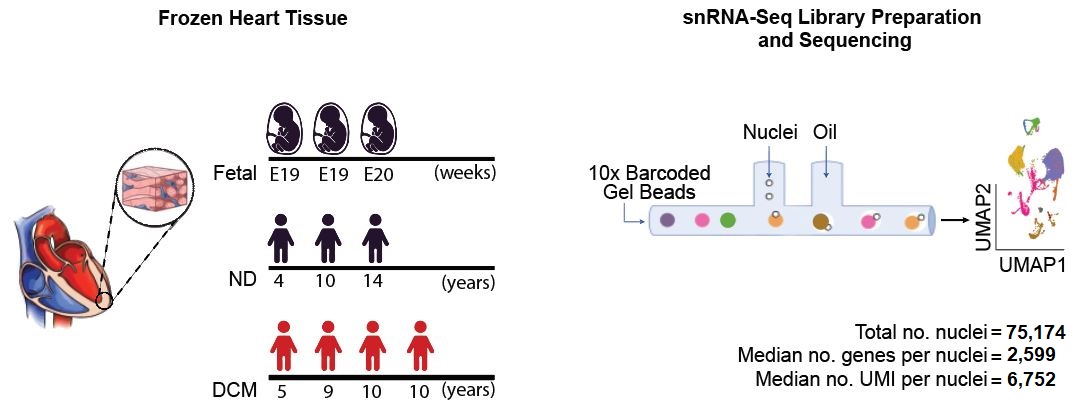
Fig.1A Summary of experimental design showing total number of biological samples and nuclei sequenced, as well as the median number of genes and unique molecular identifiers (UMI) detected per nucleus.
| Fetal1 | Fetal2 | Fetal3 | |
|---|---|---|---|
| Age, weeks | E19 | E19 | E20 |
| Sex | Male | Male | Female |
| Diagnosis | Healthy non-cardiovascular disease | Healthy non-cardiovascular disease | Healthy non-cardiovascular disease |
| ND1 | ND2 | ND3 | |
|---|---|---|---|
| Age, years | 4 | 10 | 14 |
| Sex | Male | Female | Male |
| Diagnosis | Healthy non-cardiovascular disease | Healthy non-cardiovascular disease | Healthy non-cardiovascular disease |
| DCM1 | DCM2 | DCM3 | DCM4 | |
|---|---|---|---|---|
| Age, years | 5 | 10 | 9 | 10 |
| Sex | Male | Female | Female | Female |
| Left ventricular ejection fraction, % | 6.9 | 21.5 | 36.8 | 13.9 |
| Fractional shortening, % | 3 | 10.1 | 18.2 | 6.4 |
| Brain natriuretic peptide, pg/mL | 532 | 2699 | 2793 | 164 |
| Mutation | Homozygous DSP frameshift variant | Homozygous DSP frameshift variant | ACTC1 missense variant | Heterozygous for 2 missense variants found in TNNC1 and MYH6 |
| Family history of heart failure | Yes | Yes | No | No |
| Consanguinity | Yes | Yes | No | No |
| Time since first diagnosis of heart failure, days | 241 | 30 | 13 | 106 |
| Extracorporeal membrane oxygenation | Yes | No | Yes | No |
| Ventricular assist device | Yes | Yes | Yes | Yes |
| Transplant | Yes | Yes | Yes | Yes |
| Implantable cardioverter-defibrillator | No | Yes | No | No |
| Tissue sample collection time | Transplant | LVAD | LVAD | Transplant |
| Antiplatelet agents and dual antiplatelet therapy | Aspirin | - | Aspirin | Aspirin |
| Anticoagulants | - | Warfarin (Coumadin) | - | Warfarin (Coumadin) |
| Ace inhibitors | - | Lisinopril (Prinivil, Zestril) | Enalapril (Vasotec) | Enalapril (Vasotec) |
| Combined alpha and beta blockers | Carvedilol | Carvedilol | Carvedilol | - |
| Diuretics | Furosemide (Lasix), Spironolactone (Aldactone), Metolazone | Furosemide (Lasix), Spironolactone (Aldactone) | Furosemide (Lasix), Spironolactone (Aldactone) | Furosemide (Lasix) |
| Calcium channel blockers | - | - | - | Diltiazem (Cardizem, Tiazac) |
| Other medications | Milrinone, Losartan, Amiodarone | - | Milrinone, Nifedipine, Amlodipine, Clonidine | Adrenaline, Milrinone, Cefotaxime, Vancomycin |
Conclusions:
This work provides insights into the critical gene expression networks that underpin DCM disease pathogenesis in children.
Please address correspondence to:
Associate Professor Enzo R. PorrelloMurdoch Children's Research Institute
Parkville, Melbourne, VIC, 3052, Australia
Tel: +61 3 9936 6140
Email: enzo.porrello@mcri.edu.au
Associate Professor David E. Elliott
Murdoch Children's Research Institute
Parkville, Melbourne, VIC, 3052, Australia
Tel: +61 3 9936 6668
Email: david.elliott@mcri.edu.au
If you tweet about this website, please use the #heartExplorer hashtag. Tweet #heartExplorer
For more information about our research projects, please check our CardioRegen Project Website.
If you encounter any bugs, please report it to:
Email: neda.rahmanimehdiaba@mcri.edu.auwith support from
Cardiac Nuclei Isolation
Cardiac nuclei were isolated as previously described[1] with minor modifications. In brief, heart tissue samples were dissected and minced into approximately 1 mm^3 cube pieces and electrically homogenized (IKA) in 15 mL lysis buffer (0.32 M sucrose, 10 mM Tris-HCl (pH = 8), 5 mM CaCl2, 5 mM magnesium acetate, 2 mM EDTA, 0.5 mM EGTA, 1 mM DTT and 1X Complete Protease Inhibitor). For single nucleus RNA sequencing (RNA-seq), ~20-100 mg of human left ventricular tissue was used per sample whereas ~0.5-1 g of tissue was required for bulk RNA-seq of purified cardiomyocyte nuclei (mouse and human). The lysate was combined with another 15 mL lysis buffer and subsequently homogenized with 15-20 strokes using a 40 mL dounce tissue grinder (Wheaton). The cell lysate was then filtered through a 100 uM cell strainer followed by 70 uM and 40 uM cell strainers (BD Falcon) and then centrifuged to pellet nuclei at 1000xg (Beckman Coulter Allegra X-15R) for 5 mins. Nuclei pellets were then resuspended in 1 M sucrose buffer (1 M sucrose, 10 mM Tris-HCl (pH = 8), 5 mM magnesium acetate, 1 mM DTT and 1X Complete Protease Inhibitor) and the suspension was cushioned on top of 2X volume of the sucrose buffer, followed by centrifugation to pellet nuclei at 1000xg for 5 mins. All steps were conducted on ice. Isolated cardiac nuclei pellets were washed once in PBS (Thermo Fisher Scientific) and centrifuged to pellet nuclei at 1000xg. Nuclei pellets were then resuspended in PBS prior to FACS sorting.
Single Nucleus RNA-seq Library Preparation and Sequencing
Isolated nuclei were stained with Hoechst 33342 (Thermo Fisher Scientific) prior to sorting on an Influx cell sorter (BD) with 70 uM nozzle and 60 psi pressure setting. Sorted nuclei were counted on a haemocytometer to calculate nuclei density and then loaded onto the Chromium Controller 4 (10X Genomics) for gel bead emulsion (GEM) formation with ~10,000 nuclei loaded per sample for library preparation. Following GEM formation, library preparation was conducted according to the manufacturer's recommended protocol using the Chromium Next GEM Single Cell 3' GEM, Library & Gel Bead Kit v3.1. Libraries were sequenced on the NovaSeq 6000 (Illumina) at 50,000 reads per nuclei resolution.
Bioinformatics Analysis for Single Nuclei RNA Sequencing
Raw fastq reads for each sample were mapped, processed, and counted using Cell Ranger (v3.0.2). Following this, the counts were then aggregated together to create a table of unique molecular identifier (UMI) counts for 33,939 genes for each of the samples. All pre-processing and filtering steps of the datasets were subsequently carried out using the R statistical programming language (v3.6.0). The quality of the cells was assessed for each sample independently by examining the total number of cells, the distributions of total UMI counts, the number of unique genes detected per sample and the proportions of ribosomal and mitochondrial content per cell. Briefly, following the removal of mitochondrial, ribosomal genes as well as those genes that were not annotated, genes that had at least one count in at least 20 cells were selected for downstream analysis, assuming a minimum cluster size of 20 cells. All genes on the X and Y chromosomes were removed prior to clustering. For each sample, we performed SCTransform normalization[2], data integration of the biological replicates[3-5], data scaling and graph-based clustering separately, using the R package Seurat (v3.0.2). Data integration of the biological replicates for each group was performed using CCA[4] from the Seurat package with 30 dimensions and 3000 integration anchors followed by data scaling. Clustering of the cells was performed with 20 principal components (PCs) and an initial resolution of 0.3. Marker genes to annotate clusters were identified as significantly up-regulated genes for each cluster using moderated t-tests, accounting for the mean variance trend and employing robust empirical Bayes shrinkage of the variances, followed by TREAT tests specifying a log-fold-change threshold of 0.5 and false discovery rate (FDR) cut off <0.05, using the limma R package (v3.40.2). Moreover, heatmaps showing expression of previously published marker genes were used to aid in interpretation of the clusters. Visualization of the datasets was primarily carried out using nonlinear dimensionality reduction UMAP[6] plots.
References
[1]Bergmann O, Jovinge S. Isolation of cardiomyocyte nuclei from post-mortem tissue.J Vis Exp. 2012; 65:e4205. doi: 10.3791/4205
[2]Hafemeister, C., Satija, R. Normalization and variance stabilization of single-cell RNA-seq data using regularized negative binomial regression. Genome Biol 20, 296 (2019). doi: https://doi.org/10.1186/s13059-019-1874-1
[3]Butler A, Hoffman P, Smibert P, Papalexi E, Satija R. Integrating single-cell transcriptomic data across different conditions, technologies, and species. Nat Biotechnol. 2018 Jun;36(5):411-420. doi: 10.1038/nbt.4096
[4]Stuart T, Butler A, Hoffman P, Hafemeister C, Papalexi E, Mauck WM 3rd, Hao Y, Stoeckius M, Smibert P, Satija R. Comprehensive Integration of Single-Cell Data. Cell. 2019 Jun 13;177(7):1888-1902.e21. doi: 10.1016/j.cell.2019.05.031
[5]Stuart, T., Satija, R. Integrative single-cell analysis. Nat Rev Genet 20, 257-272 (2019). https://doi.org/10.1038/s41576-019-0093-7
[6]Becht E, McInnes L, Healy J, Dutertre CA, Kwok IWH, Ng LG, Ginhoux F, Newell EW. Dimensionality reduction for visualizing single-cell data using UMAP. Nat Biotechnol. 2018 Dec 3. doi: 10.1038/nbt.4314
Data and code availability
All snRNA-seq raw fastq.gz files including sample details have been deposited to Gene Expression Omnibus under accession No. GSE185100.
Comprehensive bioinformatics analyses with the source code can be retrieved from analysis website and source code, respectively.
Also, the code used to build this website is available on github/HeartExplorer.